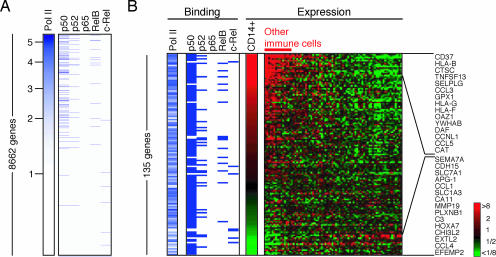
Fig. 2.
Co-occupation of promoters by NF-κB and RNA polymerase II in unstimulated cells. (A) DNA binding of RNA polymerase II and NF-κB subunits in unstimulated cells. The genes are sorted by RNA polymerase II binding ratio (marked on the left). Genes occupied by each NF-κB subunit are marked by a blue dash. (B) Binding and expression data for 135 genes that are bound by at least one NF-κB subunit in unstimulated cells and annotated in the expression data. Expression levels are relative to the average expression of genes across 79 different human tissue or cell types. Red, higher than average expression; green, lower than average, according to the scale shown to the right. Selected overexpressed and underexpressed genes are named on the right.

