Fig. 4.
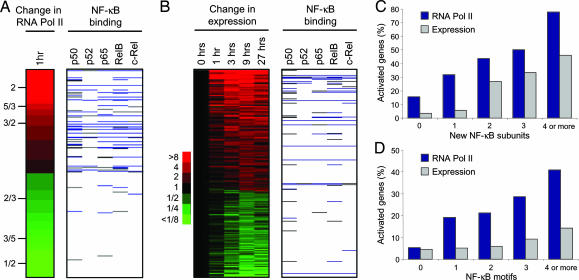
Recruitment of multiple NF-κB family members leads to increased RNA polymerase II occupancy and gene expression. (A) NF-κB binding at genes to which RNA polymerase II is recruited and to genes where it is lost (top 5% of genes for both categories). The change in RNA polymerase binding is represented as a ratio, with red indicating an increase and green indicating a decrease, according to the scale on the left. Only genes bound by RNA polymerase II in either unstimulated or activated cells were used. Gray, binding of NF-κB subunits at P values < 0.01; blue, binding at P values < 0.002. (B) NF-κB binding at genes that are up-regulated or down-regulated over time in response to LPS in U937 cells. Genes were either up-regulated by 2-fold or down-regulated by 2-fold at two consecutive time points. Red, increase in expression; green, decrease in expression, according to the scale on the left. (C) The percentage of genes to which 1, 2, 3, or 4 or more different NF-κB family members are recruited that show an increase in RNA polymerase II occupancy (blue bars) or an increase in RNA abundance (gray bars) after LPS stimulation. (D) The percentage of genes whose promoters contain 1, 2, 3, or 4 or more NF-κB binding motifs that show an increase in RNA polymerase II occupancy (blue bars) or an increase in RNA abundance (gray bars) after LPS stimulation. The binding motif was defined as GGGRNNYYCC and was counted if present within or 200 bp either side of the promoter element represented on the array.

