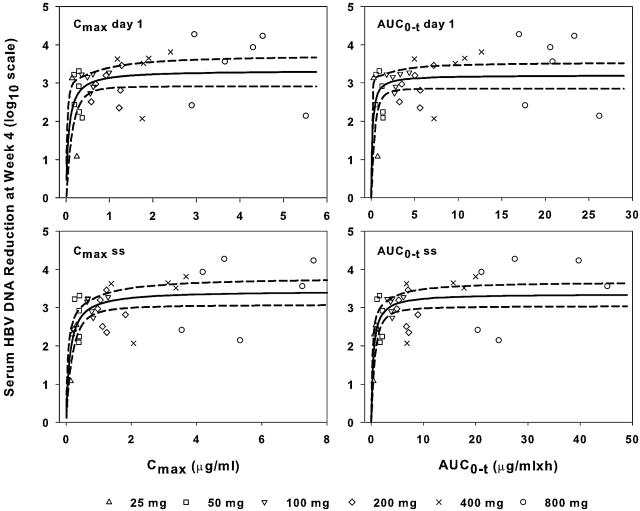
FIG. 2.
Plots of serum HBV DNA reduction at week 4 versus single-dose and steady-state telbivudine pharmacokinetic parameters underlying plasma exposure (Cmax and AUC0-t). Solid and dashed lines, the Emax model-predicted response curves and associated 95% confidence intervals, respectively. The symbols represent the dose groups.

