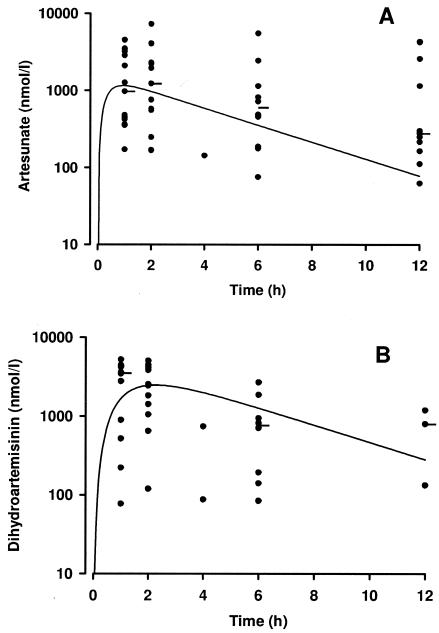
FIG. 2.
(A) Plasma artesunate and (B) dihydroartemisinin concentrations from 15 children following an 11-mg/kg dose of rectal artesunate. The closed circles are individual datum points, while the horizontal bars show median concentrations at the different times. The solid lines show simulated (using mean pharmacokinetic parameters) concentration-time profiles from our previous study of children with uncomplicated malaria (16).

