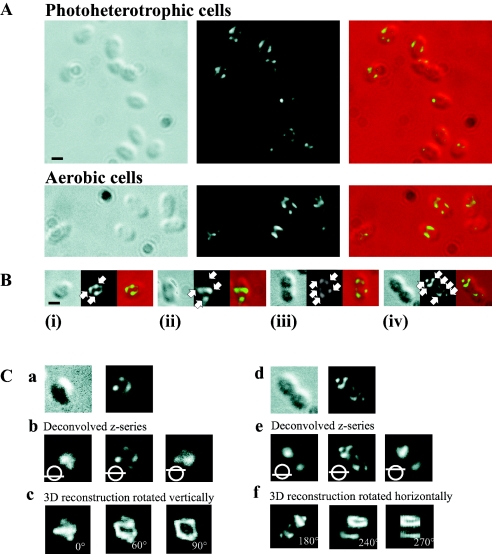
FIG. 1.
Localization of PBP2 in R. sphaeroides cells by immunofluorescence microscopy. (A) Localization in 2D. DIC images, fluorescence images, and an overlay of these images are shown from left to right. Bar, 1 μm. Representative fields of photoheterotrophic and aerobic cells. (B) Photoheterotrophic cells representing the different stages of the cell cycle: (i) newly formed, (ii) elongating, (iii) septation initiating, and (iv) septation nearing completion. The white arrows highlight the regions of intense fluorescence termed foci. In newly formed cells, two or three PBP2 foci were organized into bands across the cell. The number of PBP2 foci increased in elongating cells; two of these foci were commonly observed to form bands across the cell near midcell. As the cell cycle progressed to and through septation, PBP2 foci were observed to form bands across the cell near to the midcell sites of the forming daughter cells. The scale bar represents 1 μm. (C) 3D reconstruction of the PBP2 subcellular structure. (a) DIC and fluorescence images of a newly formed cell. (b) Optical sections through this cell; the bottom, middle, and top of the z series are shown. (c) 3D reconstruction of the z series at 0°, 60°, and 90°; the images are rotated vertically. (d) DIC and fluorescence images of a septating cell. (e) Optical sections through this cell; the bottom, middle, and top of the z series are shown. (f) 3D reconstruction of the z series at 180°, 240°, and 270°; the images are rotated horizontally. The cells in panel C are enlarged relative to those in panel A. No scale bar is presented for panel C, as the 3D reconstruction process can fractionally distorts the image parameters, and therefore, a scale bar might prove misleading in terms of the dimensions of the 3D reconstruction structure.

