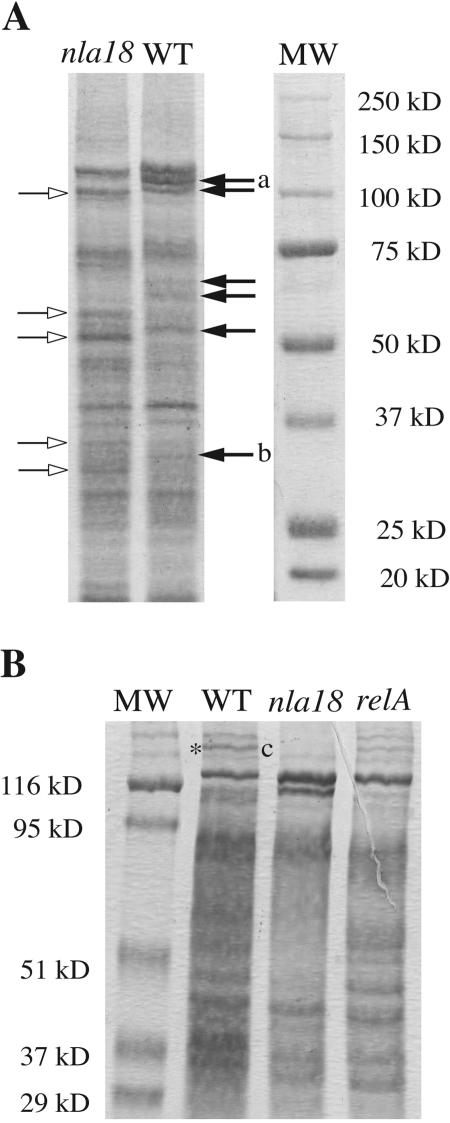
FIG. 6.
Membrane protein profiles of wild-type (WT) and mutant cells. (A) Membranes of wild-type (DK1622) and nla18 mutant (AG318) cells were isolated by sucrose density gradient centrifugation and run on a 7.5% SDS-PAGE gel. The same total amount of protein was loaded into each lane. Proteins were visualized with Coomassie brilliant blue R-250 stain, and Precision Plus Protein All Blue standards (Bio-Rad) were used as a reference (MW). The empty and black arrows represent protein bands whose expression appears to increase or decrease in the nla18 mutant, respectively. Bands excised and identified by peptide mass mapping are labeled “a” and “b.” The larger band, band a, is the Oar protein, and band b is Mx_2915, which is a hypothetical protein. The absence of these bands in the nla18 mutant is consistent with our DNA microarray data (Fig. 5). (B) Membranes of isogenic wild-type (DK101), nla18 mutant (AG339), and relA mutant (MS1000) cells were isolated via quick whole-membrane preparation as described in Materials and Methods and run on a 7.5% SDS-PAGE gel. The same total amount of protein was loaded into each lane. Proteins were visualized with Coomassie brilliant blue R-250 stain, and prestained SDS-PAGE broad-range standards (Bio-Rad) were used as a reference (MW). The band excised and identified by peptide mass mapping is flanked by an asterisk and the letter “c.” This band, Mx_4332 (a putative membrane protein), is present in the relA mutant, albeit at a lower intensity than in the wild type. The absence of this band in the nla18 mutant is consistent with our DNA microarray data (Fig. 5).

