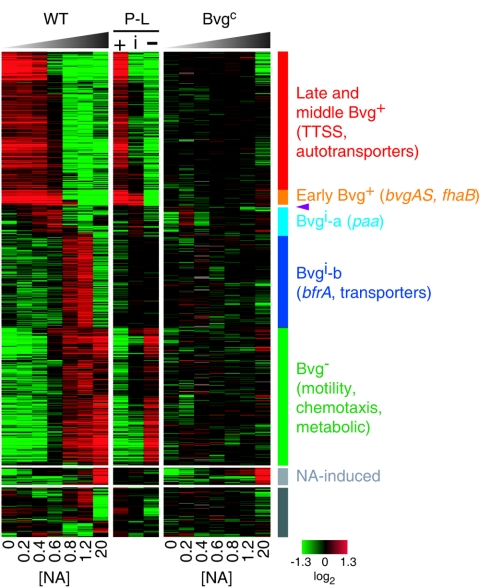
FIG. 3.
Patterns of Bvg-regulated gene expression in B. bronchiseptica RB50. Within each experiment, data are centered and shown from Bvg+ (left) to Bvg− (right). Rows correspond to array probes, and columns correspond to experiments. +, phase-locked Bvg+; i, phase-locked Bvgi; −, phase-locked Bvg−. Red, increased transcript abundance; green, decreased transcript abundance; black, no significant change in transcript abundance; gray, no data. NA concentrations (millimolar) are indicated along the bottom. The five major gene expression classes, with some representative loci, and the Bvg-independent NA-induced class are indicated on the right. Purple arrowhead, bipA. The set of genes represented by the gray bar on the right passed filtering criteria but showed no discernible pattern.

