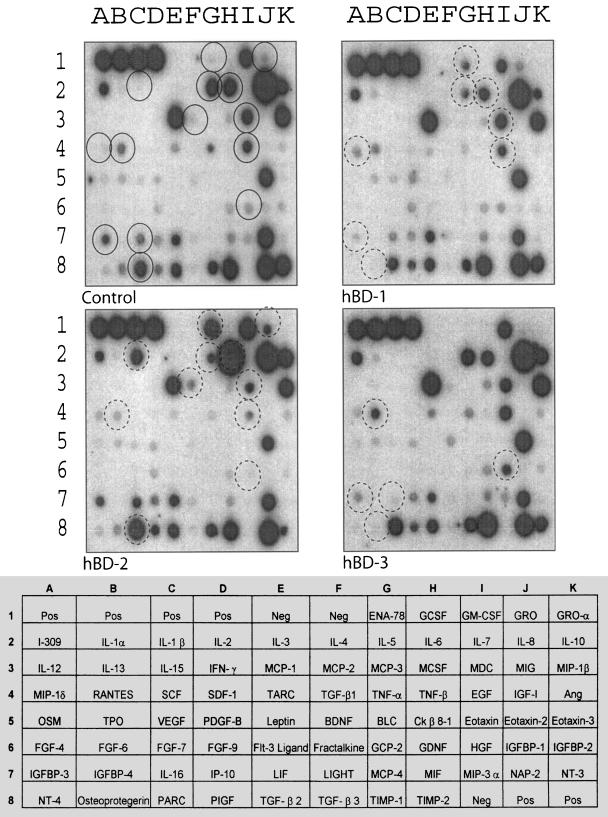
FIG. 5.
Protein array analysis demonstrating the effects of hBD-1, -2, and -3 on PBMC cytokine profile after 6 days of stimulation. Whole PBMCs were either left untreated or treated with 20 μg/ml of hBD-1, hBD-2, and hBD-3 for 6 days. Spots with differentially regulated cytokines are identified by circles. Circles correspond to MIP-1-δ (A4), IGFBP-3 (A7), RANTES (B4), OPG (B8), IL-1-β (C2), IL-16 (C7), MCP-2 (F3), ENA-78 (G1), IL-5 (G2), IL-6 (H2), MDC (I3), EGF (I4), HGF (I6), and GRO (J1). Minor changes were suggested in MCP-1, PARC, and TIMP-2.

