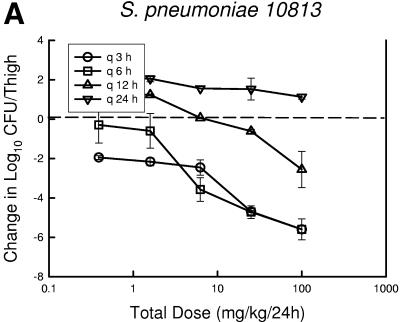
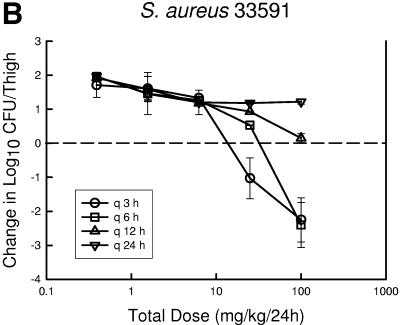
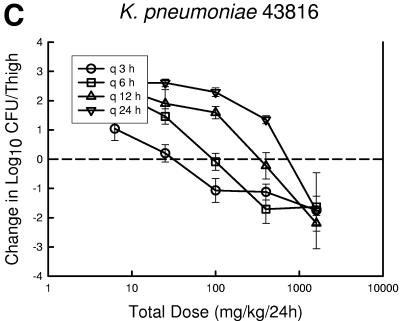
FIG.3.
Relationship between PPI-0903 dosing interval and efficacy against S. pneumoniae ATCC 10813 (a), S. aureus ATCC 33591 (b), and K. pneumoniae ATCC 43816 (c) in a murine thigh infection model. Each symbol represents the mean data from two mice (four thighs). The dashed horizontal line represents the burden of organisms at the start of therapy. Data below the line represent killing, and data above the line show growth.


