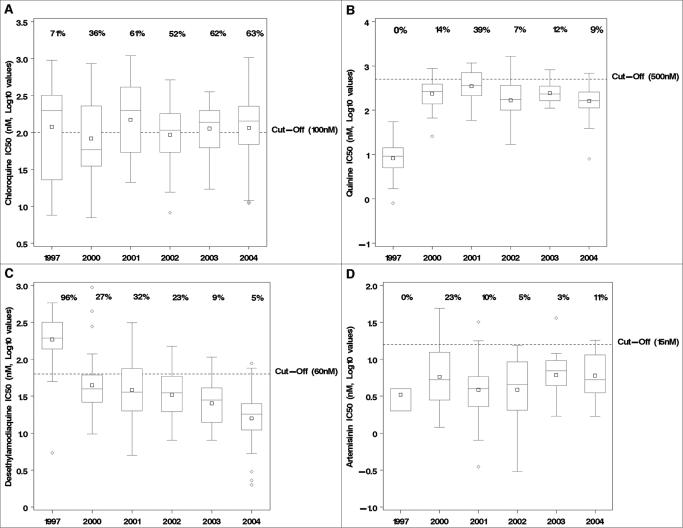
FIG. 1.
Box plots of log-transformed IC50s (in nM) for chloroquine (a), quinine (b), monodesethyl amodiaquine (c), and artemisinin (d) by year (1997 and 2000 to 2004). The percentages of isolates above the cutoff value for in vitro resistance (dotted horizontal lines) are displayed for each drug. The top (or the base) of the whisker corresponds to the largest (or the lowest) observed value within the 1.5× interquartile range (IQ) from the 75th (or 25th) percentile. □, mean; ⋄, values outside 1.5× IQ.

