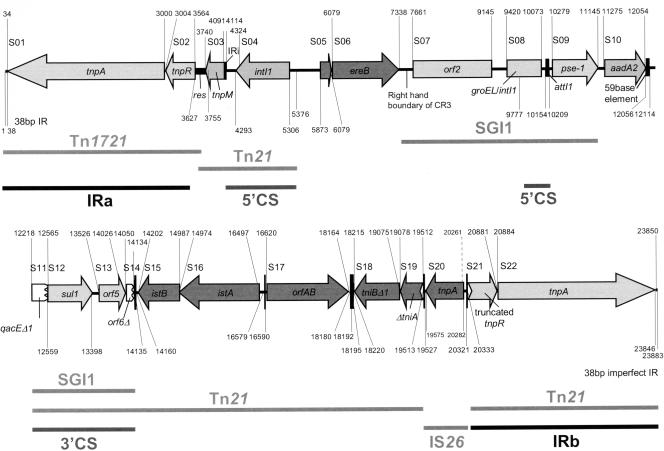
FIG. 2.
Genetic organization of Tn2610 based on complete nucleotide sequence analysis. Labeled lines represent the regions in which sequences exhibit significant homology to extant sequences on various genetic elements. The accession numbers of the sequences used for comparative analysis are given in Table 1.

