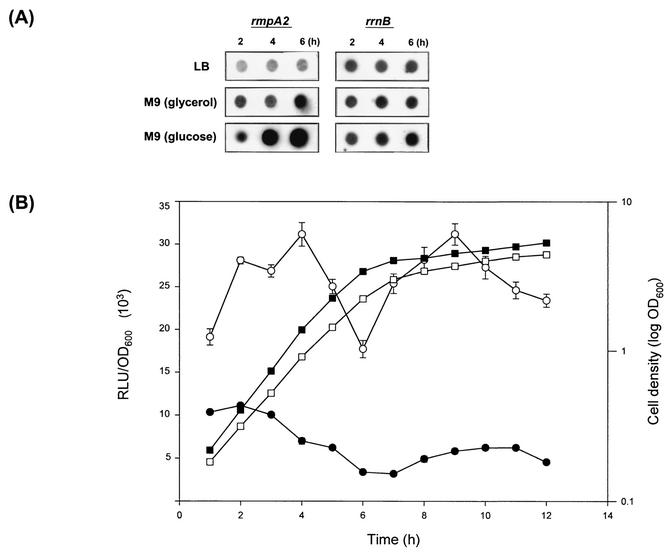
FIG. 7.
(A) Dot blot analysis of rmpA2 transcripts in cells grown under different nutritional conditions. Three different time points—2, 4, and 6 h—were investigated. The rrnB gene was an internal control. (B) Time course analysis of PrmpA2::luxAB expression. K. pneumoniae R2035[pYC082] was grown in LB (solid symbols) or M9-glycerol (open symbols). Luciferase activity (circles) and the bacterial cell density (squares) were measured every hour and are represented as the average of triplicate results (error bars, standard deviations). RLU, relative light units.

