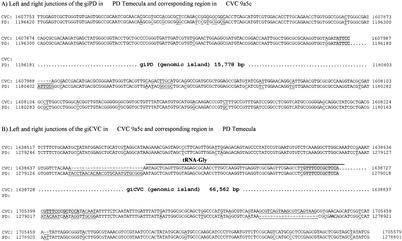
FIG. 3.
Comparative analysis of giPD1 and giCVC1 insertion sites. Shaded nucleotides represent the target duplication sites for each genomic island insertion. Underlined bases indicate substitutions or indels. Numbers on both sides indicate the coordinates of each genome. The coordinates for the primers used in the PCR analysis of the islands are as follows: for giPD1—P1 (PD, 1179403 to 1179420; CVC, 1608980 to 1608963), P2 (PD, 1180466 to 1180449), P3 (PD, 1194838 to 1194855), and P4 (PD, 1196338 to 1196321; CVC, 1607835 to 1607852); for giCVC1—XFUN01 (PD, 1280237 to 1280220; CVC, 1638293 to 1638310), XFCVC01R (CVC, 1639020 to 1639003), XFCVC01F (CVC, 1707041 to 1707058), and XFUN03 (PD, 1275650 to 1275667; CVC, 1707862 to 1707845).

