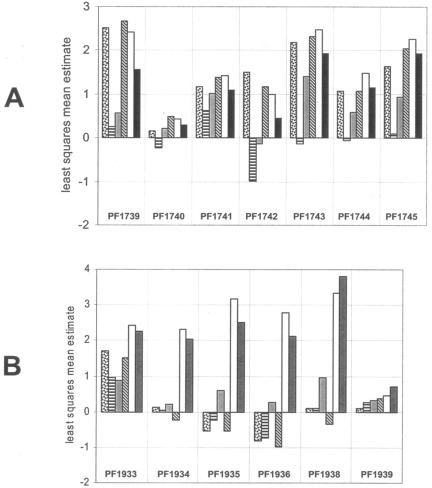
FIG. 2.
Relative expression patterns for the Mal-I (A) and Mal-II (B) operons on six different sugars. The height of each bar represents the least squares mean estimate for a given gene during growth on a given substrate, as calculated by mixed model analysis (see Materials and Methods). The average least-squares mean estimate across all included genes for growth on a single substrate is 0, where genes with positive least-squares mean estimates are above the average for that substrate and genes with negative least-squares mean estimates are below the average for that substrate. Differences between least-squares mean estimates for pairs of treatments represent log2-transformed fold changes. The sugars are represented as follows: laminarin (LA), dotted bar; barley glucan, horizontal bars; cellobiose, gray; chitin, diagonal bars; maltose, white; soluble starch, solid black. The expression of PF1937 in the Mal-II cluster is not included. PF1934 and PF1935 refer to the genes in the original genome annotation and not to PF1935*.

