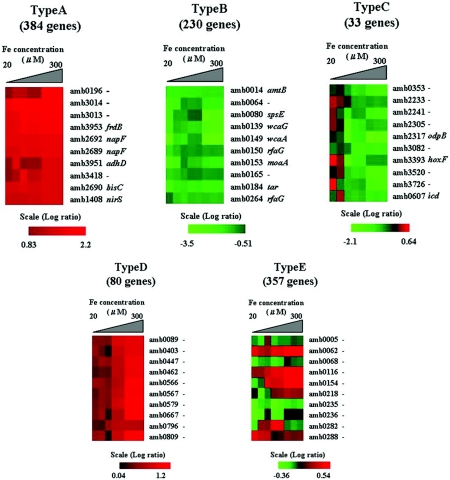
FIG.2.
Transcription profiles of genes by microarray of the whole-genome sequence of M. magneticum AMB-1. Red indicates positive, and green indicates negative, as shown in the scale bars (log2 ratio). The genes were categorized into five groups based on their expression at different iron concentrations (20 to 300 μM). Type A shows genes that were up-regulated above a 20 μM initial iron concentration. Type B genes were down-regulated above a 20 μM initial iron concentration. Type C genes were down-regulated above a 100 μM initial iron concentration. Type D genes were up-regulated above a 100 to 150 μM initial iron concentrations. Type E genes were not affected at any initial iron concentration. Microarray experiments were demonstrated with three biological replicates and used duplicate microarray slides (different lot number). The remaining genes which did not fall into any category showed a very inconsistent expression profile. The genes did not show distinct down- or up-regulation at any specific iron concentration. Slides were scanned with a ScanArray Lite apparatus (model 900-3011538000; PerkinElmer Japan Co., Ltd.). Visualization of expression pattern data was done with Vector Xpression Software (InforMax Inc., Frederick, Md.).

