FIG. 1.
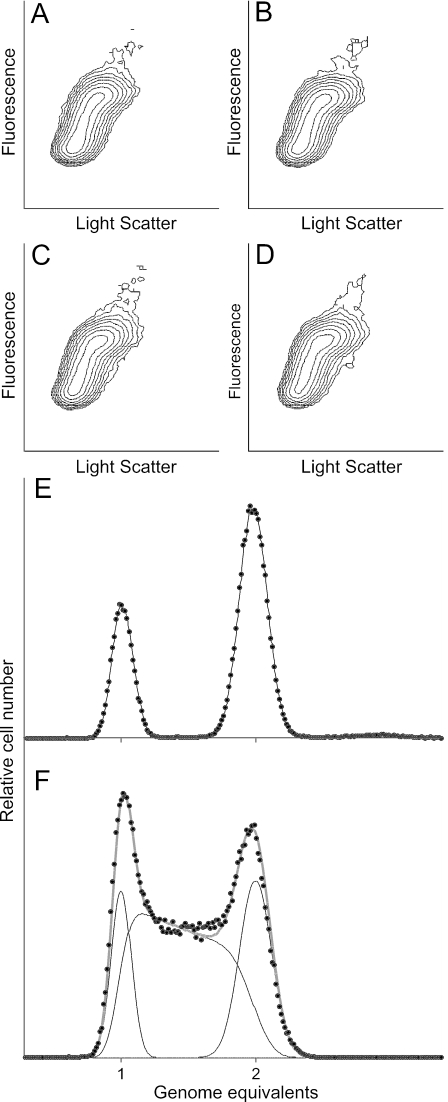
Analysis of the cell cycle in tagged and wild-type Caulobacter cells using flow cytometry. (A to D) Cytograms showing the sizes and DNA contents of Caulobacter cells with specific regions of the chromosome labeled using CFP-LacI. Orthogonal light scatter is proportional to cell size, and fluorescence is proportional to the DNA content of the cells. (A and B) Cytograms of strain RBJ185 in which a cassette containing tandem repeated lac operators is integrated near the origin. (C and D) Cytograms of strain RBJ200 in which the lac operator cassette is integrated in the terminus region of the chromosome. (A and C) Strains in the absence of expression of the CFP-LacI protein. (B and D) Cytograms of the same cultures after induction of CFP-LacI as described in Materials and Methods. Approximately 100,000 cells were analyzed. (E and F) Analysis of the cell cycle in exponentially growing wild-type Caulobacter cells using computer simulations of DNA histograms obtained by flow cytometry. (E) DNA distribution pattern (solid circles) of wild-type strain CB15N treated with rifampin to block initiation of replication and cephalexin to block cell division. Ongoing rounds of DNA replication continue, resulting in accumulation of cells with either one or two fully replicated chromosomes. The data were used to determine the means and standard deviations of normal distributions fitted to the one- and two-chromosome peaks. (F) DNA distribution pattern (solid circles) of a mixed untreated exponentially growing CB15N culture. Simulations of the cells in the G1, S, and G2/M phases are indicated by thin black lines. The thick gray curve represents the sum of the simulated cells in different stages of the cell cycle. The means and standard deviations for the one- and two-chromosome peaks obtained from rifampin-treated cells (A) were used in the simulation to determine the proportions of cells in the different cell cycle stages.

