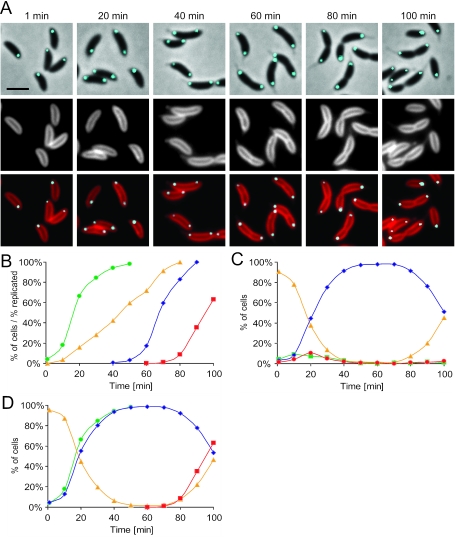
FIG. 2.
Intracellular location of the origin-proximal region of the chromosome during the Caulobacter cell cycle. (A) Phase-contrast and fluorescence microscopy images of RBJ185 cells with the origin-proximal part of the chromosome tagged using CFP-LacI. The cells were synchronized, and samples were removed at different times after incubation of the isolated swarmer cells in PYE growth medium. The top panel shows overlays of phase-contrast and CFP fluorescence (cyan) images. The middle panel shows fluorescence signals from the dye FM4-64, which specifically binds to the cytoplasmic membrane. The lower panel shows overlays of the fluorescence signals of the cytoplasmic membrane dye (red) and the CFP fluorescence (cyan) marking the position of the origin-proximal region of the chromosome. Scale bar = 2 μm. (B) DNA replication and cell division status of the synchronized culture determined using flow cytometry. The green circles indicate the percentage of cells that have initiated DNA replication, the yellow triangles indicate the progression of DNA replication, the blue diamonds indicate the percentage of cells that have completed chromosome replication, and the red squares indicate the percentage of cells that have divided. (C) Quantification of the abundance of cells with different origin localization patterns. The yellow triangles indicate cells with a single origin focus in the pole-proximal 15% of the cell, the green squares indicate cells with a single origin focus in other parts of the cell, the blue diamonds indicate cells with two bipolarly located origin foci, and the red circles indicate cells with two origin foci with other localization patterns (e.g., one focus at a pole and one focus near the middle of the cell). (D) Data from panels B and C combined. The yellow triangles indicate cells with a single pole-proximal origin focus, the green circles indicate cells that have initiated DNA replication, the blue diamonds indicate cells with two origin foci, and the red squares indicate cells that have divided.

