FIG. 3.
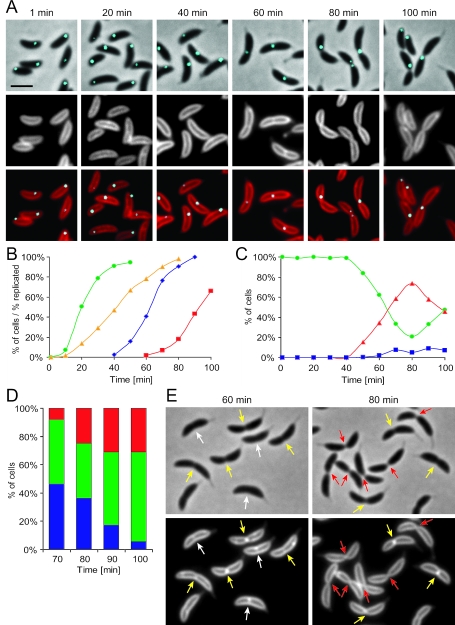
Intracellular location of the chromosomal terminus region during the Caulobacter cell cycle. (A) Fluorescence and phase-contrast microscopy images of RBJ200 cells with the terminus region tagged using CFP-LacI progressing synchronously through the cell cycle. The top panel shows overlays of phase-contrast and CFP fluorescence (cyan) images. The middle panel shows the FM4-64-labeled cytoplasmic membrane. The lower panel shows overlays of the fluorescence signals of the cytoplasmic membrane dye (red) and the CFP fluorescence (cyan) marking the position of the chromosome terminus region. Scale bar =2 μm. (B) DNA replication and cell division status of the synchronized culture. The green circles indicate cells that have initiated DNA replication, the yellow triangles indicate the progression of DNA replication, the blue diamonds indicate cells that have completely replicated the chromosome, and the red squares indicate cells that have divided. (C) Quantification of cells with different terminus localization patterns and the presence of an invagination at the future division site. The green circles indicate smooth cells with a single terminus focus, the red triangles indicate cells with a single terminus focus that have a visible constriction at the future division site, showing that the cell division process has been initiated, and the blue squares indicate constricted cells with two separated terminus foci. No smooth cells with two terminus foci were observed. (D) Quantification of the location of the terminus focus in predivisional cells at different times during the cell cycle. Blue indicates cells in which the terminus focus is located in the flagellated part of the predivisional cell, green indicates predivisional cells in which the terminus focus is located at the invaginating septum, and red indicates predivisional cells with the terminus focus in the stalked part of the cell. (E) Phase-contrast and cytoplasmic membrane staining images of early and late predivisional cells having different membrane invagination patterns. The white arrows indicate cells in which a clear invagination of the cytoplasmic membrane could be seen using the cytoplasmic membrane dye but no invagination of the cell was visible by phase-contrast microscopy. The yellow arrows indicate cells with the cytoplasmic membrane invaginated and a mild indentation at the future division site that could be observed by phase-contrast microscopy. The red arrows indicate late predivisional cells in which phase-contrast microscopy showed a very deep invagination at the future division site and the cytoplasmic membrane stain indicated that separate compartments were formed in the two parts of the cell.

