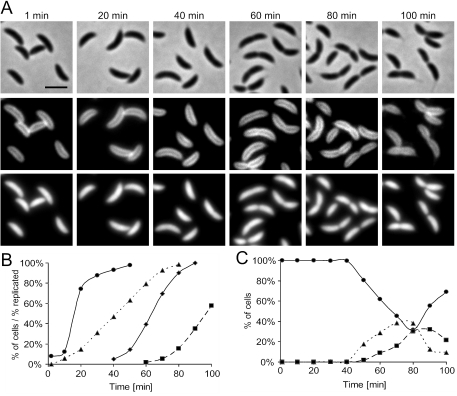
FIG. 4.
Nucleoid morphology during the Caulobacter cell cycle. (A) Phase-contrast and fluorescence microscopy images of wild-type CB15N cells with the chromosomal DNA stained using DAPI. The cells were synchronized, and cell samples were removed at different times during incubation of the isolated swarmer cells in growth medium. The top panel shows phase-contrast images, and the middle panel shows the FM4-64 signal from the cytoplasmic membrane. The lower panel shows the fluorescence signal from DAPI binding to DNA. Scale bar = 2 μm. (B) DNA replication and cell division status of the synchronized culture. The circles indicate the cells that have initiated DNA replication, the triangles indicate the progression of DNA replication, the diamonds indicate cells that have completely replicated the chromosome, and the squares indicate the cells that have divided. (C) Quantification of cells with different nucleoid morphology patterns and the presence of a constriction at the future division site. The circles indicate smooth cells with a single nucleoid, the triangles indicate cells with a single bilobed nucleoid that have a visible indentation at the future division site, and the squares indicate constricted cells with two separated nucleoids. No smooth cells with a single bilobed nucleoid or two separate nucleoids were observed.

