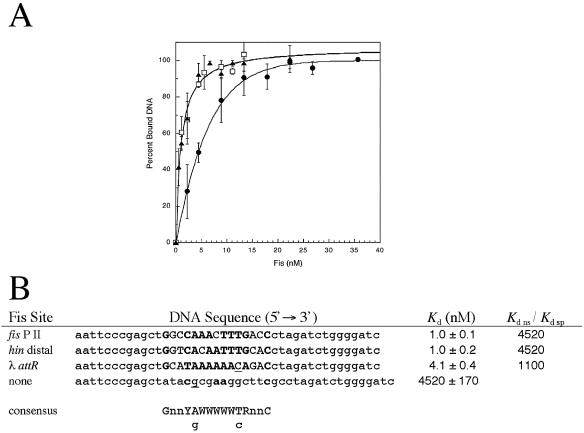
FIG. 1.
Relative Fis-DNA binding affinities. (A) Wild-type Fis protein binding to 42-bp DNA fragments containing fis P II (▴), hin distal (□), and λ attR (•) Fis sites was measured using gel mobility shift assays. The results are averages of three experiments, and the error bars indicate standard deviations. (B) Sequences of the three DNA fragments used for panel A together with the sequence of a 44-bp DNA fragment containing no recognizable Fis site. The central 15-bp core sequences of the three specific Fis binding sites are in uppercase letters and are flanked by plasmid-derived sequences. At the bottom is a consensus sequence (26) (Y = pyrimidine; R = purine; W = A or T; n = any nucleotide; lowercase g and c represent a weak preference for guanine and cytosine). Matches with the consensus sequence in the Fis binding sites are indicated by boldface type, and matches with relatively weaker preferences are underlined. The apparent Kd for Fis binding at each of the DNA fragments derived from the plots in panel A is the average ± standard deviation for three experiments. No specific bound complex was observed with the negative control DNA in gel mobility shift assays, and binding activity in this case was monitored by measuring the disappearance of the unbound DNA with increasing Fis concentrations. The ratios of Kd ns to Kd sp, obtained by dividing the Kd of the negative control DNA by the Kd of each of the three Fis binding sites, were considered a measure of binding specificity.

