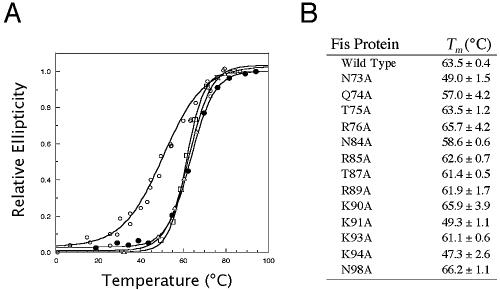
FIG. 3.
Relative stabilities of the WT and mutant Fis proteins. (A) Representative thermal denaturation curves for the wild-type (•), R85A (▵), R89A (□), and K91A (○) Fis proteins. The extent of protein unfolding was measured by determining the change in the UV circular dichroism signal at 220 nM and is expressed as relative ellipticity on a scale from 0 to 1.0. (B) Midpoint denaturation temperatures of WT and mutant proteins. The values are averages ± standard deviations for two or three experiments.

