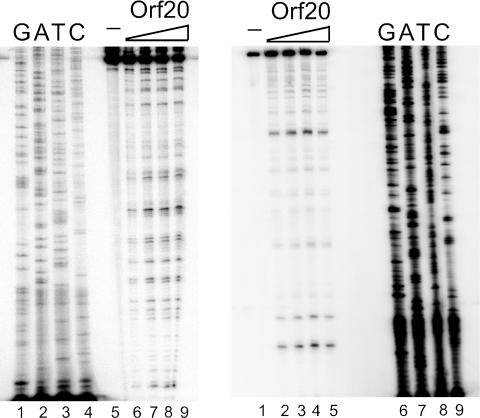
FIG. 1.
Cleavage of Tn916 oriT200-2 by MBP-Orf20. The left panel shows cleavage of the T strand. Lanes 1 to 4: DNA-sequencing reactions. Lane 5: DNA probe alone. Lanes 6 to 9: MBP-Orf20 increasing from 37.5 nM to 1.25 μM. The right panel shows cleavage of the NT strand. Lane 1: DNA probe alone. Lanes 2 to 5: MBP-Orf20 increasing from 37.5 nM to 1.25 μM. Lanes 6 to 9: DNA-sequencing reactions.

