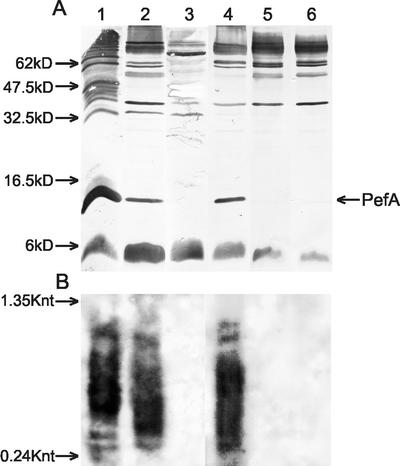
FIG. 5.
Comparison of growth conditions affecting expression of PefA and transcription of srgA. Samples were loaded in the same order for panels A and B. Panel A, Western immunoblot with anti-PefA antibodies. Molecular size standards are indicated to the left of the image. Panel B, Northern blot with srgA probe. RNA standards are indicated in kilonucleotides (Knt) to the left of the image. Lane 1, NLM2153 containing p30, grown in LB at pH 5.1; lane 2, NLM2217 grown in LB at pH 5.1; lane 3, NLM2217 grown in LB at pH 7.0; lane 4, NLM2217 grown in LB plus glucose at pH 5.1; lane 5, NLM2217 grown in LB plus glucose at pH 7.0; lane 6, NLM2153 grown in LB at pH 5.1.

