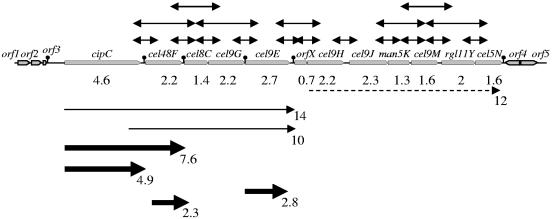
FIG. 4.
Schematic representation of the gene arrangement in the 26-kb cip-cel cluster. The 12 genes of the cluster are indicated by gray arrows. orf1 and orf2 code for putative β-lactamase and alkaline phosphatase, respectively. orf3 presents 44% similarity to a hypothetical protein-encoding sequence from Clostridium perfringens (GenBank accession no. BA000016.3 gi 47118322). orf4 and orf5 encode a putative transcriptional regulator of the LysR family and an acyl coenzyme A thioesterase module, respectively. Arrows over the map indicate the transcriptional links revealed by RT-PCR analyses. Major transcripts revealed by Northern blotting are indicated below the map by thick black arrows. Minor transcripts are shown by thin and dotted lines. Sizes in kb are indicated. Putative mRNA secondary structures are indicated downstream of orf3, cipC, cel48F, cel9G, cel9E, and cel5N. Their ΔG, calculated by the Zuker algorithm (32), are −20.4, −24.3, −34.5, −13.9, −27.5, and −21.9 kcal/mol, respectively.

