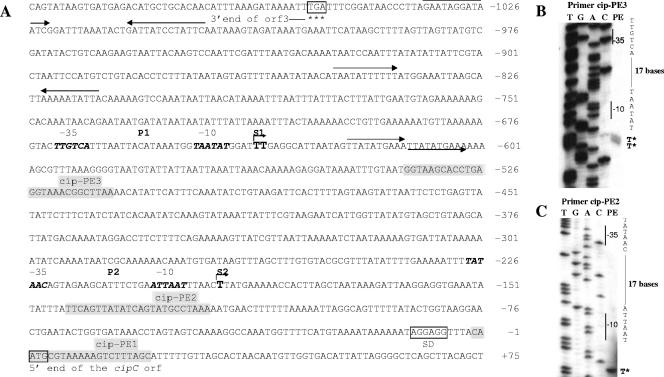
FIG. 5.
Promoter region sequence (A) and primer extension analysis (B and C) to map the transcription start sites of cipC. End-labeled primers cip-PE3 (B) and cip-PE2 (C) were used to identify the putative P1 and P2 promoter start sites S1 and S2. The same primers were used to generate the sequencing ladder by the dideoxy method (lanes marked T, G, A, and C). Primer extension products (PE) are shown to the right of the corresponding sequencing ladder on an 8% (wt/vol) sequencing gel. In panel A, the −35 and −10 regions of the putative P1 and P2 promoters are indicated in bold italics, the cip-PE1 (Fig. 6), cip-PE2, and cip-PE3 annealing regions are highlighted, the possible start sites are marked by S1 and S2 over angled arrows, and inverted or direct repeats are indicated by arrows. SD, Shine-Dalgarno sequence.

