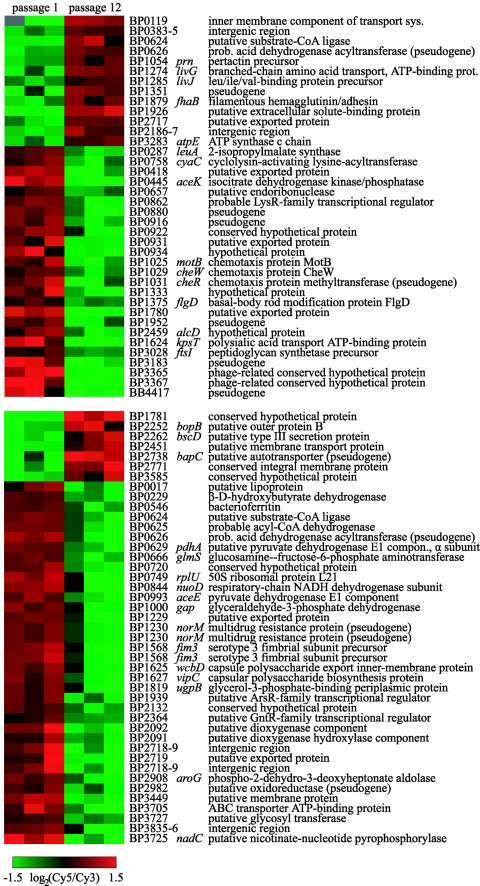
FIG. 3.
Array elements with significantly different levels of transcript abundance (determined by SAM) between the ancestral and passaged strains of clinical isolate Bpe280 during growth under Bvg+ (top) or Bvg− (bottom) conditions. Each column represents one of the triplicate cultures of each strain. In some cases, data for multiple different array elements corresponding to the same sequence are shown. Data are mean centered for each array element, and array elements are arranged by hierarchical clustering. Missing data are gray.

