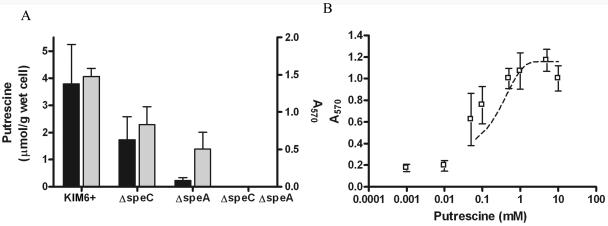
FIG. 6.
Correlation between putrescine and biofilm levels as measured by CV staining in each of the different polyamine deletion mutants. (A) The black bars show intracellular putrescine levels, while the gray bars show absorbance at 570 nm of CV from attached bacterial cells; error bars indicate standard deviations. (B) Dose-response curve of CV staining observed in the presence of putrescine in the ΔspeA ΔspeC double mutant. Below a threshold level of 0.1 mM putrescine, biofilm is clearly absent. CV staining and putrescine values are the averages of three or more independent experiments, with error bars indicating standard errors of the means. The dashed line indicates the general trend in biofilm reduction as a function of reduction in exogenous putrescine concentration.

