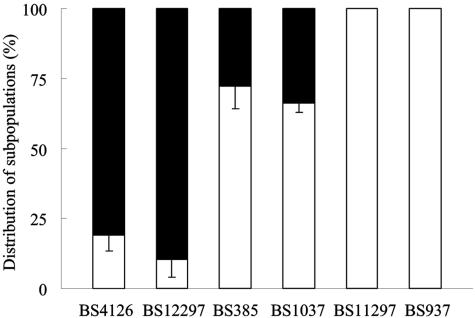
FIG. 1.
Percentage distributions of subpopulations of the fresh clinical isolates E. faecalis BS4126, BS12297, BS385, BS1037, BS11297, and BS937. Distributions were determined with zeta potential measurements in 10 mM potassium phosphate (pH 7.0). In each case, the more-negative fraction is indicated in black and the less-negative fraction in white. The bars denote standard deviations for three experiments, with each experiment comprising 100 bacteria.

