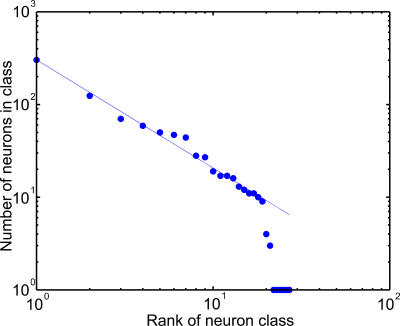
Figure 8. Distribution of WM Cells according to Their Firing Patterns.
Neurons were first grouped into classes according to their firing patterns during DMS and DPA trials (See Figure 7 for a list of the main classes). Classes were then ranked according to the number of neurons they contain, class 1 containing the largest number of neurons, class 2 the second largest number, and so on. Then, the number of cells in each class was plotted against its rank on a log–log plot. The straight fitted on the data obeys the power law: number of cells = 303 × (neuron class rank)−1.66.

