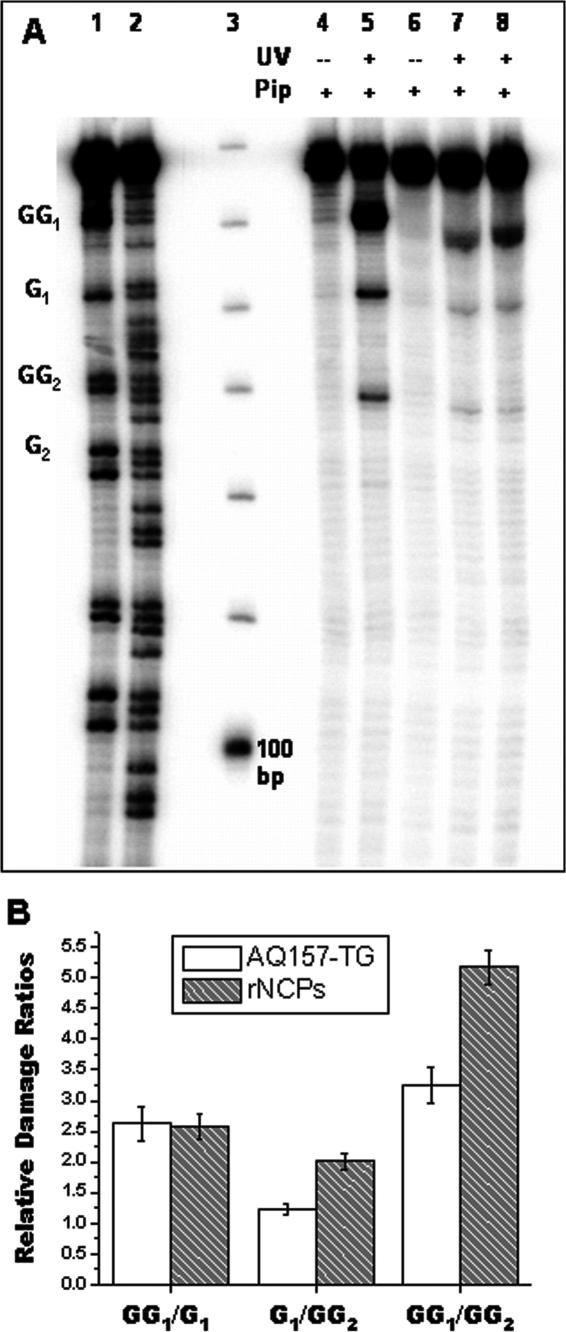
Figure 4.
(A) Visualization of DNA charge transport products in free AQ-z157TG, rNCPs, and tailless rNCPs as a function of 60 min. of UV-A irradiation and hot piperidine treatment. Lanes: (1) Maxam-Gilbert G ladder, (2) Maxam-Gilbert G+A ladder, (3) 10 bp DNA ladder, (4) free AQ-157TG, (5) free AQ-157TG, (6) AQ-157TG rNCPs, (7) AQ-157TG rNCPs, (8) tailless AQ-157TG rNCPs. (B) Graphical representation of the damage ratios GG1/G1, G1/GG2, and GG1/GG2 from Table 1.

