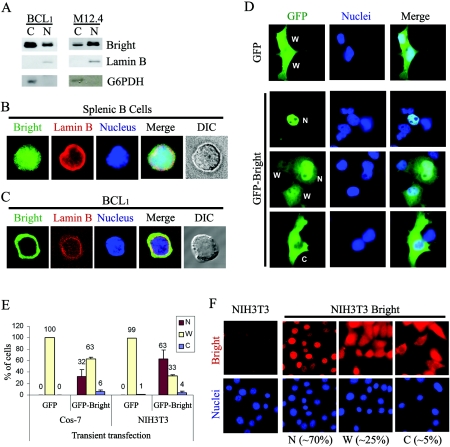
FIG. 1.
Nuclear and cytoplasmic localization of Bright. (A) Nuclear and cytoplasmic fractionation of Bright within B-cell lines BCL1 and M12.4. Five micrograms of nuclear or cytoplasmic proteins was analyzed by Western blotting with anti-Bright antiserum. The purity of the nuclear (lamin B) and cytoplasmic (G6PDH) fractions was confirmed by Western blotting of 20 μg of each extract with the appropriate antibodies. (B) Nucleocytoplasmic localization of Bright within mouse splenic B cells. Mouse CD43− splenic B cells were isolated from spleens using anti-CD43 antibody-conjugated magnetic beads. Costaining of the cells with anti-Bright (green, fluorescein isothiocyanate) and anti-lamin B (red, rhodamine) allowed discrimination between the nucleus and the relatively small volume of cytoplasm. DIC, differential interference contrast. (C) Cytoplasmic accumulation of Bright in a mature B-cell line, BCL1. Immunostaining with anti-Bright revealed various localization patterns, including a small portion of cells expressing Bright exclusively within their cytoplasm. (D) Cellular localization of GFP-Bright expressed ectopically in Cos-7 cells. The localization of GFP-Bright was determined at 24 h posttransfection of Cos-7 cells. W, dispersed across the whole cell; N, preferential nuclear localization; and C, preferential cytoplasmic localization. (E) Quantitative analysis of GFP-Bright and GFP-only localization in Cos-7 and NIH 3T3 cells after transient transfection. (F) Cellular localization of Bright ectopically and stably expressed in NIH 3T3 cells. Retroviral transduced, Bright-expressing NIH 3T3 cells or NIH 3T3 cells alone were immunostained with anti-Bright antiserum (red, rhodamine) and DAPI (blue). Population sizes are shown with the representative localization patterns. The data in panels E and F were quantified as described in Materials and Methods.

