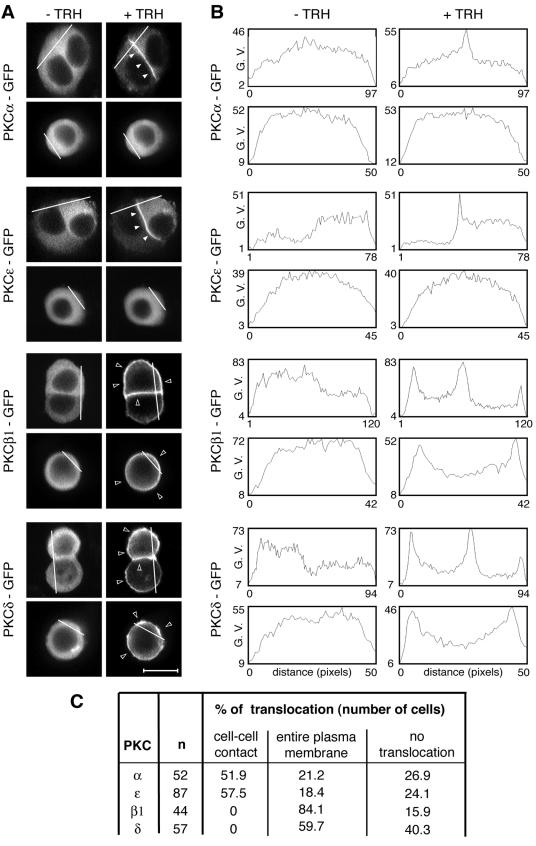
FIG. 1.
Analysis of PKCα, -β1, -ɛ, and -δ targeting in the GH3B6 cell line. (A) Micrographs depicting what we define as a targeting to the entire plasma membrane or to cell-cell contacts. PKCα, -β1, -ɛ, and -δ were subcloned in frame with GFP at the C-terminal end of their sequence in the pEGFP-N1 vector (Clontech). PKCβ1 and -δ accumulated at the entire plasma membrane in the presence (+) of 100 nM TRH, whereas PKCα and -ɛ accumulated selectively at the cell-cell contact. In isolated cells, PKCβ1 and -δ behaved as in cells in contact, whereas PKCα and -ɛ remained in the cytoplasm. Observations were performed with a confocal microscope. In Fig. 1 to 10, the empty arrowheads show translocation at the entire plasma membrane, whereas the filled arrowheads show selective translocation to cell-cell contacts. Bar, 5 μm. (B) Analysis with Image J 1.32j software (National Institutes of Health, Bethesda, Md.) was used to quantify PKC translocation and demonstrated that the pixel values increased only at the cell-cell contacts for PKCα and -ɛ, which was not the case for PKCβ1 and -δ. G. V., gray values. (C) Summary of the results as the percentages of cells where TRH-induced translocation was observed either selectively at cell-cell contacts or at the entire plasma membrane. The percentage of cells where no translocation was observed is also indicated.

