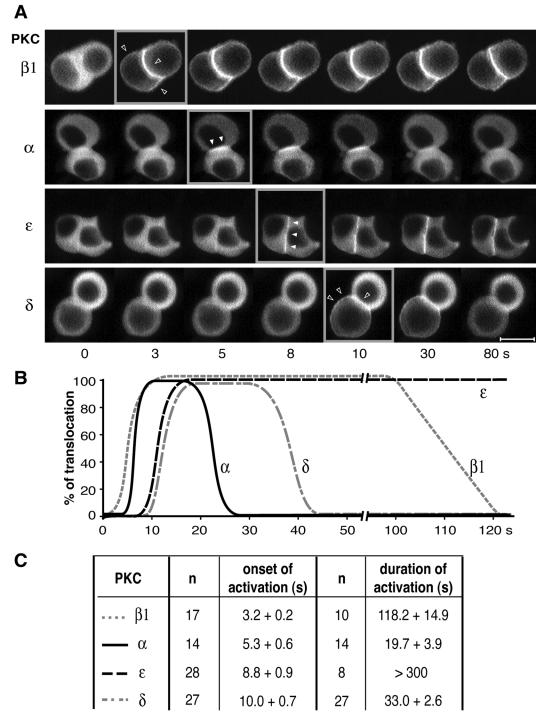
FIG. 3.
Analysis of the translocation kinetics of PKCα, -β1, -ɛ, and -δ. (A) Examples of real-time recordings of spatiotemporal activation of PKCβ1, -α, -ɛ, and -δ fused to GFP in GH3B6 cells stimulated with 100 nM TRH. Recordings were performed with a Noran confocal microscope. Images were acquired continuously, with intervals of 0.533 s between frames. Time zero is defined as the time of TRH application. Videos can be seen in the supplemental material. Bar, 5 μm. (B) Schematic representation of the data showing the different onsets and durations of PKCβ1, -α, -ɛ, and -δ translocations. (C) Statistical analysis of the data, with the number of cells analyzed. The P values were calculated with the Student t test.

