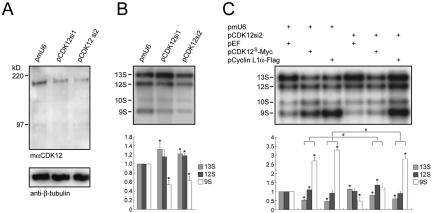
FIG. 6.
Changes in the alternative splicing pattern in cells with decreased expression of CDK12. (A and B) Proteins and RNAs of P19 cells transfected with 0.4 μg of pCEP4-E1a and 1.2 μg of pmU6, pCDK12si1, and pCDK12si2 were prepared. Proteins were subjected to Western analysis using the mαCDK12L antiserum (A). The membrane was reprobed with the anti-β-tubulin antibody. RNAs were subjected to splicing assays (B). The upper panel shows a representative autoradiograph result. Quantitative results derived from three independent experiments are shown in the lower panel. Standard deviations are indicated. * indicates P < 0.05 in comparison to the control by paired t test. (C) Splicing assays of P19 cells transfected with 0.4 μg of pCEP4-E1a and 0.6 μg of the plasmid indicated above each lane. The upper panel shows a representative autoradiograph result. The mean values and standard deviations from three independent experiments are shown in the lower panel. * indicates P < 0.05 in comparison to the control (lane 1) and # indicates P < 0.05 between the pairs marked by connecting lines.

