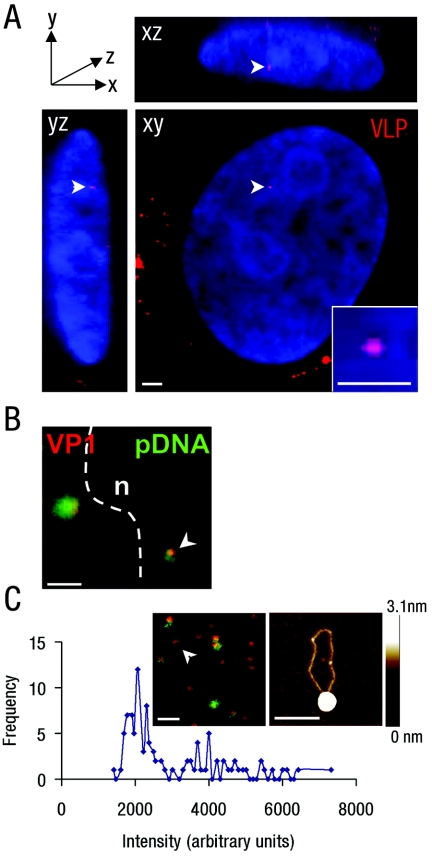
FIG. 2.
VLPs enter the nuclei of transgene-silent and transgene-active cells. (A) Three-dimensional reconstruction of sequential confocal sections of a cos7 cell nucleus in xy, xz, and yz planes, showing the sections containing a single nuclear Cy3-VLP (red; arrowhead). Nuclear DNA stained with DAPI (blue). Inset, digital zoom of single nuclear Cy3-VLP. Bars, 2 μm (main panel) and 1 μm (inset). (B) Overlay confocal images of Cy3-VLPs (red) and AlexaFluor-488-labeled pDNA (green), showing a single nuclear Cy3-VLP (arrowhead), nuclear boundary (dotted line), and nucleus (n). Control experiments with unlabeled pDNA gave a low-level diffuse signal corresponding to secondary antibody binding (data not shown). Bar, 2 μm. (C) VLPs labeled with Cy3 (on VP1 nanospheres; red) and AlexaFluor-488 (on pDNA; green) were dropped onto glass, and a single confocal section was captured (inset). Intensities of 100 individual Cy3 spots were measured and plotted according to fluorescence intensities. The intensity peak corresponding to a single VLP (approximately 2,000 arbitrary units as described previously) (23) and the fluorescence signal corresponding to a single Cy3-labeled VP1 nanosphere associated with a single AlexaFluor-488-labeled pDNA is indicated (inset of left panel, white arrowhead). Similar complexes were dropped onto mica and analyzed by AFM (inset right; height ranges are indicated by the bar to the right). Bars, 1 μm (inset left) and 200 nm (inset right).

