
Figure 3.
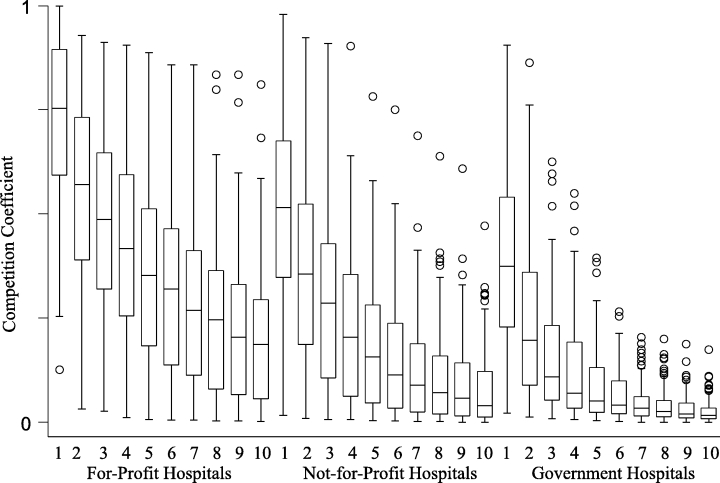
Boxplots of the Amount of Competition Received by Ten Strongest Competitors by Profit Status (n = 429)The numbers on the x-axis identify ten strongest competitors, with one being the strongest and ten being the tenth strongest. Two-way analysis of variance shows that the amount of competition received is significantly different by profit status (p <0.0001). For-profits received the most competition, while government hospitals received the least amount of competition.