Figure 5.
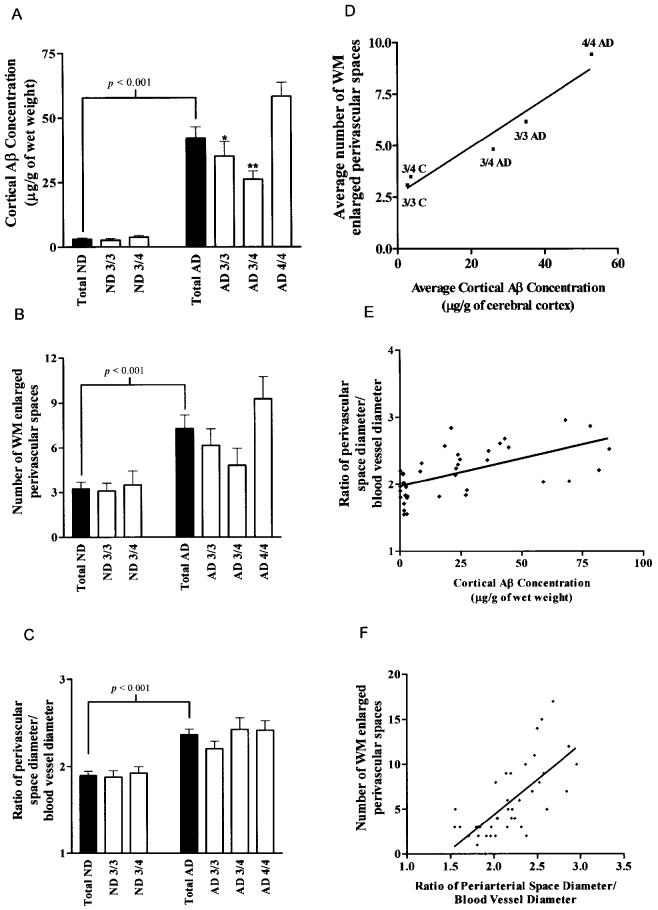
Quantitative and statistical analyses among the 3 variables investigated in this study: cortical Aβ concentrations, number of dilated perivascular spaces (état criblé–like lesions), and ratio of perivascular space diameter/blood vessel diameter. In the 3 left panels, ▪ and □ histograms represent the total numbers of ND and AD individuals and these populations divided by Apo E genotype, respectively. The 3 panels on the right side of the figure demonstrate the linear correlations and P values among the 3 studied variables. A: The total levels of cortical Aβ in ND and AD subjects. P value represents the 2-tailed unpaired Student t-test probability. * and ** represent P < 0.05 and P < 0.01, respectively, in post-hoc analysis (Newman-Keuls Multiple Comparison Test) after 1-way analysis of variance demonstrated that there was a significant difference among the AD subgroups. B: The average number of WM enlarged perivascular spaces (état criblé–like lesions) in the ND and AD groups. P value represents the 2-tailed unpaired Student t-test probability. C: Mean ratios of perivascular space diameter/blood vessel diameter observed in ND and AD cohorts. P value represents the 2-tailed unpaired Student t-test probability. D: Linear correlation (R = 0.97) between the mean number of WM enlarged perivascular spaces and average levels of cortical Aβ when the AD and control subjects were grouped by Apo E genotype. E: Linear correlation between the ratio of perivascular space diameter to blood vessel diameter and the total levels of cortical Aβ (R = 0.55; P < 0.001). F: Linear correlation between the mean number of WM enlarged perivascular spaces and the ratio of perivascular space diameter to blood vessel diameter (R = 0.70; P < 0.001).

