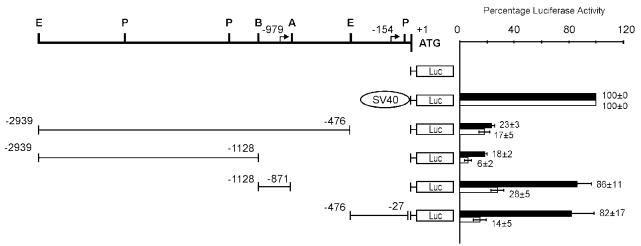
Figure 5.
Identification of 2 HMGA2 gene promoter regions active in retinoblastoma cells. Analysis was conducted in HMGA2-positive WERI-Rb1 and HMGA2-negative OSH50T cells. The schematic diagrams on the left show the organization of various plasmids constructed by subcloning different segments of the human HMGA2 5′ UTR genomic fragments in forward orientation into the upstream region of the firefly luciferase gene (in pGL2-Basic vector) used in the transient transfection experiments. + 1 corresponds to the A of the initiator methionine codon, and residues preceding it are represented by negative numbers. The top bold line shows the restriction sites of the 5′ UTR (A, ApaLI; B, BamHI; E, EcoRI; P, PstI) and the location of the 2 transcription start sites are represented by bent arrows (at nt −154 and −979; Figure 6 and 7). On the right is the relative luciferase activity (expressed as percent of pGL2-SV40 Promoter expression) upon cotransfection of different luciferase reporter plasmids and pCAT-Control Vector (used as internal control). Luciferase activity measured was normalized to the corresponding CAT activity for each sample. Values represent the average of 3 double transfections, and bars of standard error of mean are shown, of which black and white bars show that of WERI-Rb1 and OSH50T cells accordingly.

