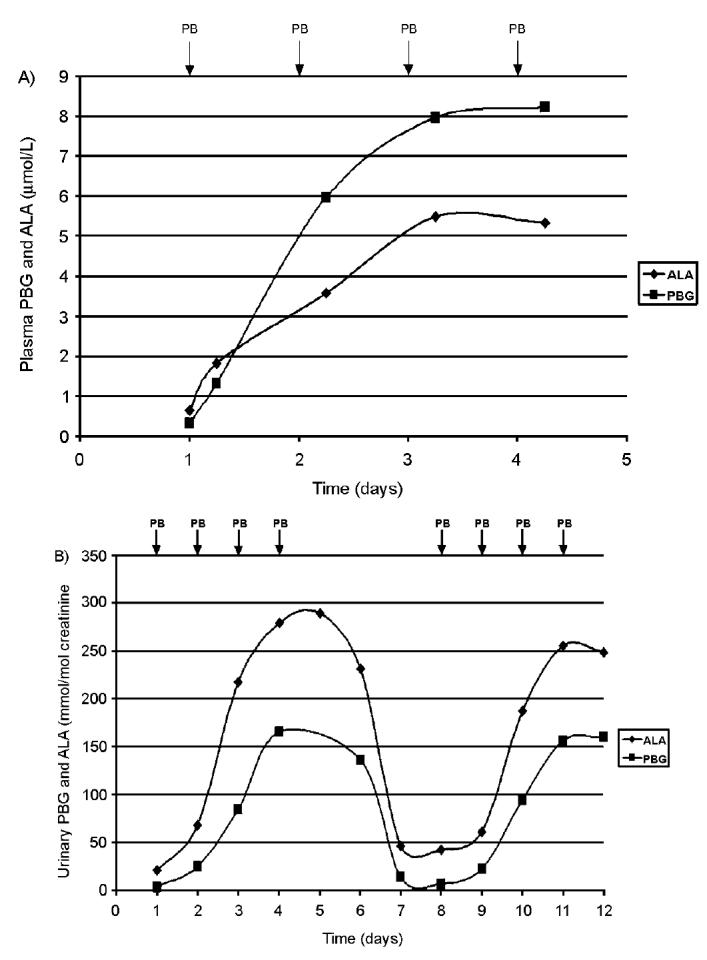
Figure 2.

Time-course analysis of levels of PBG and ALA in plasma (A) and urine (B) in PBGD-deficient mice administered with increasing dose of phenobarbital (75, 80, 85, and 90 mg/kg body weight) for 4 d (days 1 to 4). The plasma data represent the mean value from 2 male mice and the urine data from 1 male mouse out of 3 trials. The arrows indicate time of phenobarbital administration (PB). Blood was taken 6 h after each phenobarbital dose and the concentrations of PBG and ALA are expressed as μmol/L. In (B) the results from a 2nd 4-d administration of phenobarbital are presented (days 8 to 11). Urine was collected in 24-h fractions and PBG and ALA concentrations were expressed as mmol/mol creatinine.
