
Figure 1.
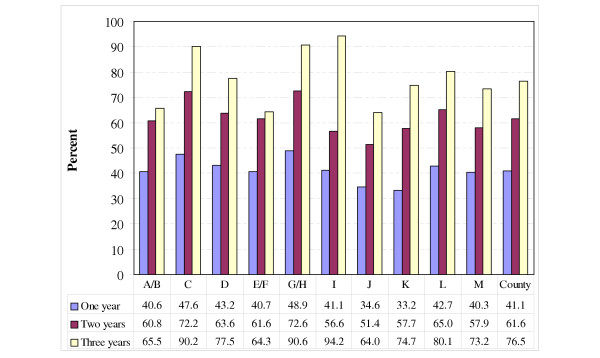
Proportion of inhabitants with a diagnosis-registered encounter with a GP at 13 PHC centres (A-M), and average on the county level for the time periods: calendar year 2003, calendar years 2002–2003 and 2001–2003.
Official websites use .gov
A
.gov website belongs to an official
government organization in the United States.
Secure .gov websites use HTTPS
A lock (
) or https:// means you've safely
connected to the .gov website. Share sensitive
information only on official, secure websites.
Proportion of inhabitants with a diagnosis-registered encounter with a GP at 13 PHC centres (A-M), and average on the county level for the time periods: calendar year 2003, calendar years 2002–2003 and 2001–2003.