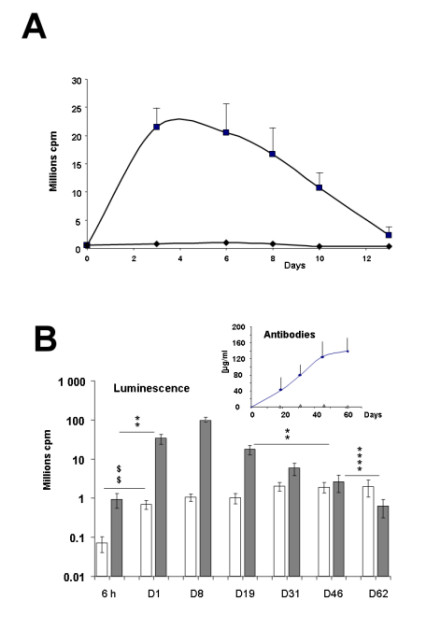
Figure 6.

In vivo kinetic of luciferase expression in the knee joint and in the tibial cranial muscle and antibody concentration in blood serum after electrotransfer of luciferase-encoding plasmid. Panel A: Mean + SEM (n = 8) of the integrated values of luminescence in region of interest (ROI) of the knee joint at different times after electrotransfer of 60 μg/10 μl of pC1-luc plasmid (black square symbols) or empty plasmid (black diamond symbols). The in vivo luminescence was assayed 2 minutes after luciferin injection into the joint. Panel B: Mean ± SEM (n= 6 to 10) of the integrated values of luminescence in region of interest (ROI) of the tibial cranial muscle at different times after electrotransfer of 0.3 μg (White columns) or 30 μg (grey columns) of pC1 luc plasmid. The in vivo luminescence was assayed 2 minutes after luciferin injection into the electrotransfered muscle. For all point background luminescence was subtracted. Statistical significance for comparisons of luminescence between different times after electrotransfer of 30 μg of plasmid **** p < 0.0001, ** p < 0.01; after electrotransfer of 0.3 μg of plasmid $$ p < 0.01 Inset: Mean + SEM (n = 5) of the concentration of antibodies against luciferase in the blood serum at different times after electrotransfer of 0.3 μg (empty triangles) or 30 μg (black diamon) of pC1 luc plasmid into the muscle.
