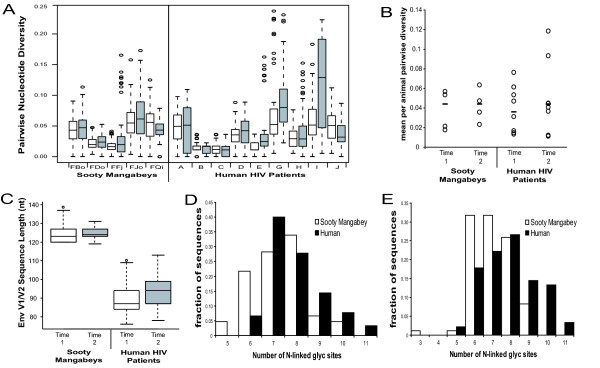
Figure 7.
Comparison of SIVsm and HIV-1 V1V2 sequences. Longitudinal SIVsm and HIV-1 env sequences were aligned and homologous regions were compared with respect to nucleotide diversity, sequence length, and glycosylation density at an early time point (Time 1) and a time point approximately 2.5 years later (Time 2). (A) Standard box and whisker plots of the distributions of intra-animal pairwise nucleotide diversity. Time 1 is in white, time 2 is in gray, and circles represent outliers of the distribution. (B) Intra-animal average pairwise diversity at each time point. Median values are indicated with a slash. (C) Standard box and whisker plots of intra-animal env V1V2 sequence length at each time point. (D) and (E) N-linked glycosylation sites at time 1 and time 2, respectively. SMs are in white and humans are in black.

