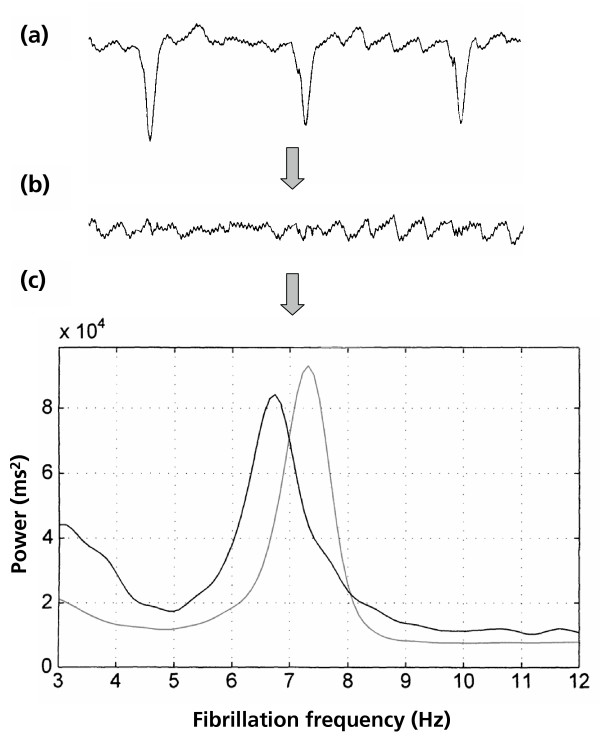
Figure 1.
Illustration of the FAF-ECG method. Illustration of the process by which DACL is calculated, and explanation of the additional parameters which were tested in this study. (a) The digital ECG is analysed and the QRST identified and templated. (b) The template is then subtracted from the raw ECG to give a signal representing the atrial fibrillation alone. (c) The frequency at which the peak is seen is expressed as a cycle length to give the DACL. The DACL recorded from lead V1 (black line) is longer (i.e. fibrillation frequency lower) than that in oesophageal lead (grey line) in this patient, which is the most common finding.

