
Figure 1.
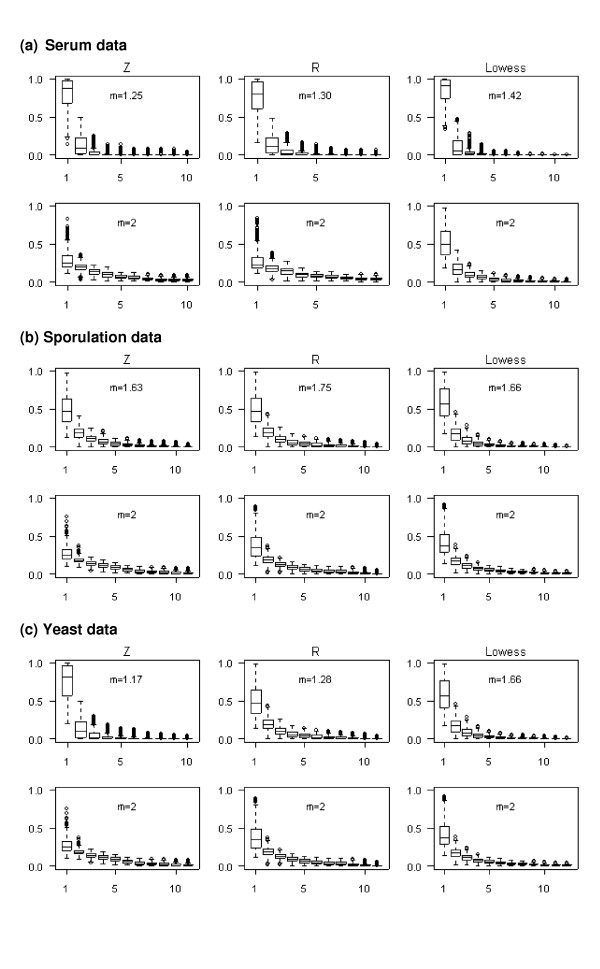
Boxplots of sorted membership values for real data. Boxplots of sorted membership values for three real datasets normalized by the Z, R or Lowess method, after FCM clustering using an m value of 2 or the optimal value. The x-axis indicates the sorted membership values for each gene (highest, second highest, etc.) and the y-axis indicates the membership value. (a) serum data, (b) sporulation data and (c) yeast data.