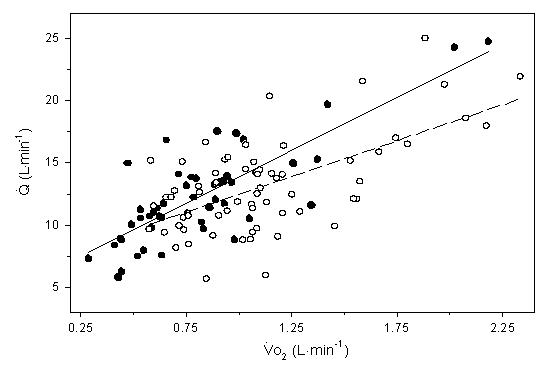
Figure 1.

Regression lines showing the relationship between cardiac output (Q) and oxygen uptake (Vo2) during submaximal exercise for paced patients ( ) Q= 8.6 (Vo2) + 5.3, r = 0.81, p < 0.001; and healthy controls (
 ) Q= 5.8 (Vo2) + 6.7, r = 0.62, p < 0.001. There were no significant differences in the slopes between groups (p > 0.05)
