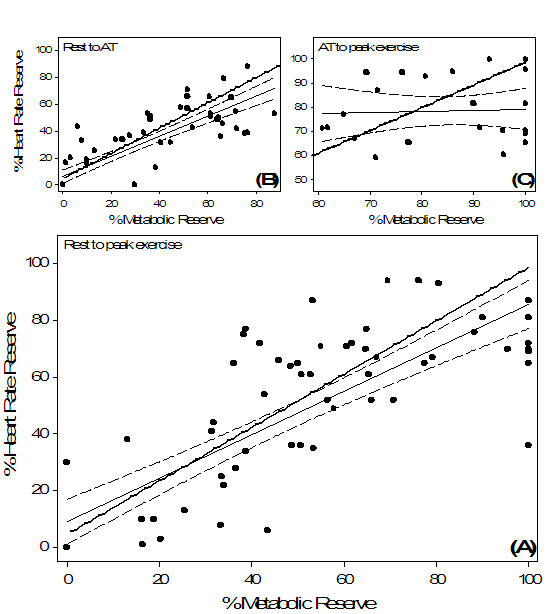
Figure 4.

Chronotropic response index (CRI) for paced patients ( , regression
  and 95% confidence interval
  ) versus Wilkoff’s[6]. model (
 ) for healthy subjects. The CRI was calculated from (A) rest to peak exercise: %HRR = 0.77 (%MR) + 8.98, r = 0.81, p < 0.001 and (B) rest to anaerobic threshold (AT): %HRR = 0.75 (%MR) + 6.13, r = 0.85, p < 0.001. There was no difference in the slopes between patients and the healthy reference response model from rest to peak exercise (A) and from rest to AT (B) (p > 0.05). The regression from AT to peak exercise (C) was not significant (p > 0.05) and was therefore not compared with the reference line
