
Figure 5.
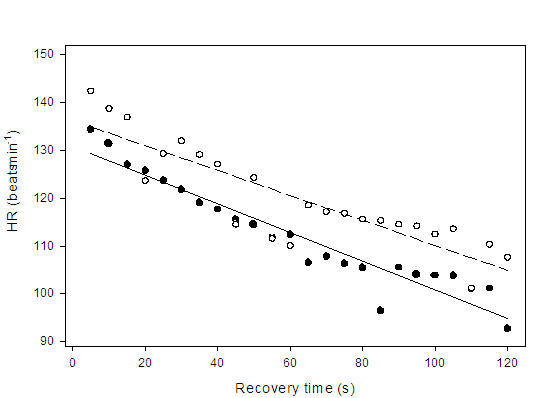
Regression lines showing the relationship between heart rate (HR) decay and recovery time from peak exercise (Time 0) through the first 120 seconds of recovery for paced patients ( ) HR = -0.30 (recovery time) + 130.9, r = 0.96, p < 0.001; and healthy controls (
 ) HR = -0.26 (recovery time) + 136.2, r = 0.87, p < 0.001. Data points represent 5 sec averages. There were no significant differences in the slopes between groups (p > 0.05)