
Figure 1.
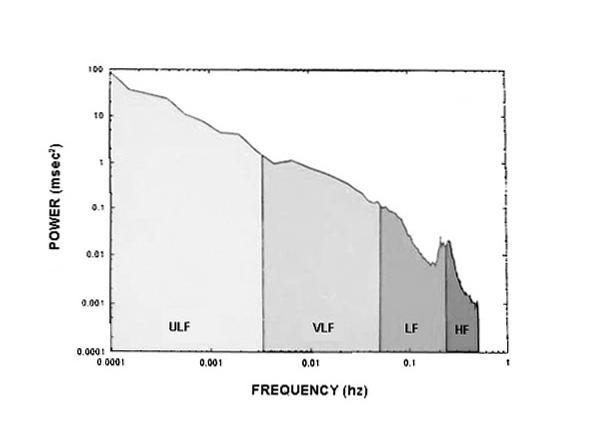
Log: log plot of the HRV power spectrum over 24 hours. The region between 0.01 and 0.0001 Hz is used to calculate power law slope
Official websites use .gov
A
.gov website belongs to an official
government organization in the United States.
Secure .gov websites use HTTPS
A lock (
) or https:// means you've safely
connected to the .gov website. Share sensitive
information only on official, secure websites.
Log: log plot of the HRV power spectrum over 24 hours. The region between 0.01 and 0.0001 Hz is used to calculate power law slope