
Figure 4.
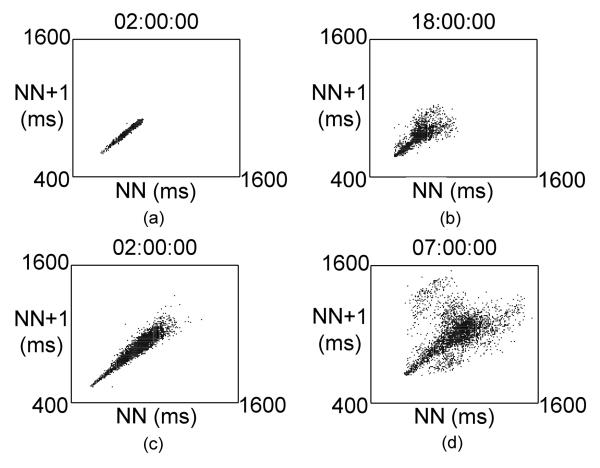
Representative one hour Poincaré plots. Figures 4a) and 4c) show normal HRV patterns. Figures 4b) and 4d) show abnormal, complex HRV patterns
Official websites use .gov
A
.gov website belongs to an official
government organization in the United States.
Secure .gov websites use HTTPS
A lock (
) or https:// means you've safely
connected to the .gov website. Share sensitive
information only on official, secure websites.
Representative one hour Poincaré plots. Figures 4a) and 4c) show normal HRV patterns. Figures 4b) and 4d) show abnormal, complex HRV patterns