Figure 1.

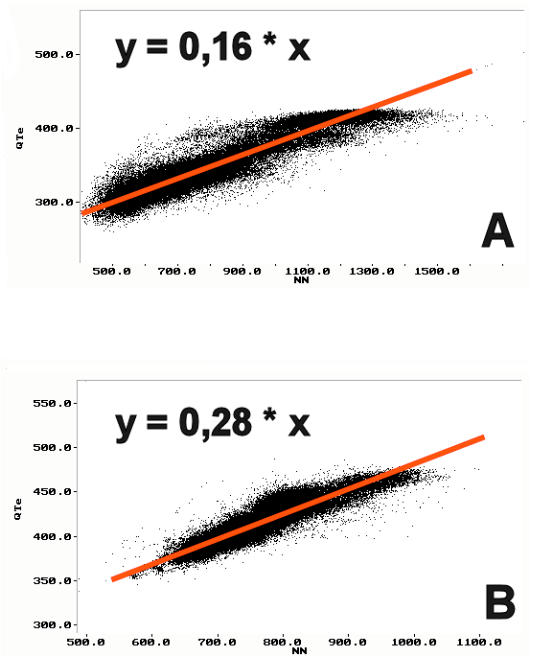
QT/RR linear regression slopes recorded from a healthy subject (A), and from a patient with ischemic heart disease and in NYHA functional class IV (B).

QT/RR linear regression slopes recorded from a healthy subject (A), and from a patient with ischemic heart disease and in NYHA functional class IV (B).